Spread Betting and CFDs are complex instruments and come with a high risk of losing money rapidly due to leverage. 67.8% of retail investor accounts lose money when trading Spread Betting and CFDs with this provider. You should consider whether you understand how Spread Betting and CFDs work and whether you can afford to take the high risk of losing your money
Trading Guides – Reversal patterns
What is a reversal pattern?
Reversal patterns are used for charting analysis, some key reversal patterns: head and shoulders, double tops, double bottoms, triple tops and triple bottoms.
If a market has been falling for a while it can be very tempting to look for opportunities to buy it. After all, if a market has already fallen then psychologically buying it at this lower level feels as if we’re getting a bargain. But who’s to say that it can’t fall further? In fact, traders are often warned not to try to catch falling knives. The problem with a market that’s selling off is that downside moves can quickly pick up momentum and result in severe losses for would-be “bottom pickers”. So, when consolidation is taking place after a downturn we would like to have a pattern showing us that either the market looks likely to fall further (continuation) or that a reversal is on the cards by giving us a strong “buy” signal.
By the same token it’s always tempting to try and time the market and sell at the top. But as we’ve seen over the past eight years with US stock indices, this is easier said than done. Many traders had had their fingers burnt trying to call the top of this long equity market rally. So once again, it’s useful to look out for specific patterns which can help us identify when a market may be “topping out.” That is, when the upside momentum has been exhausted and a corrective sell-off is on the cards.
Reversal patterns:
The most common reversal patterns in an uptrend are head-and-shoulders, double tops and triple tops. The most common reversal patterns in a downtrend are reverse head-and-shoulders, double bottoms and triple bottoms.
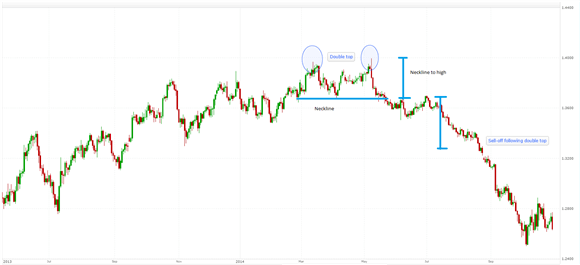
Here’s an example of a market that has been trending higher but then puts in a double top before declining sharply. This is a chart of the EURUSD and the double top occurred during the summer of 2014.
Reversal patterns double bottom:
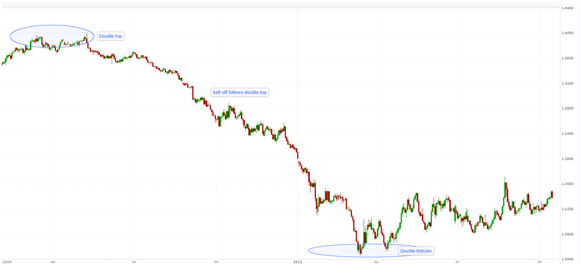
Here’s an example of a double bottom. Once again, it’s the chart of the EURUSD and you can see the old “double top” over on the left hand. This foreshadowed a sharp sell-off which continued until the EURUSD put in a double bottom in March/April 2015. Prices subsequently pushed higher, although they went on to trade within a range for the next year or so. Nevertheless, this double bottom signalled the end of the sell-off and it took until December 2016 for the currency pair to break below the low established as part of the double bottom in March 2015.
Reversal patterns triple top:
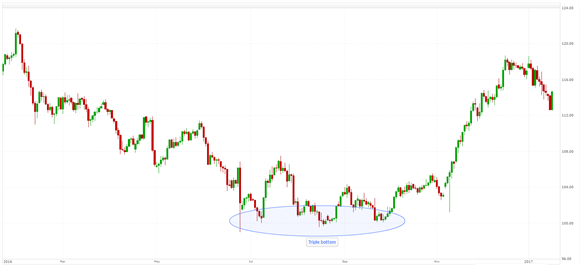
A triple top is less common but often a stronger signal. Of course, the very fact that a double top must occur before there’s any chance of a triple top underlines the importance of sensible risk management when initiating positions after a double top. Care must be taken to put the stop far enough away to allow for a further upside move, but not too far away to risk excessive losses.
Reversal patterns quadruple top:
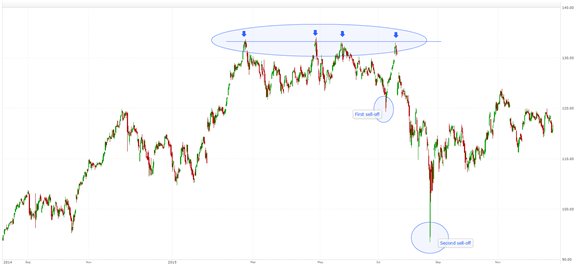
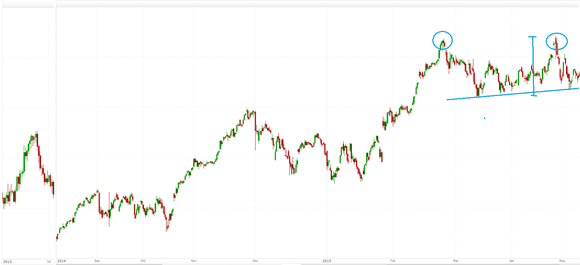
Here’s a 4-hour chart of Apple showing a quadruple top formed between February and June 2015. We can see that the stock sold off after testing the highs for a third time before bouncing back to retest the high for a fourth, and final, time. So this had the potential to confuse. However, there’s a useful rule which should be followed when trading on the back of any of these chart formations. First of all, it is important to identify the neckline for double, triple, quadruple or head-and-shoulder patterns. This is a horizontal line which marks the low point reached by prices between a double top, or links up the lows made subsequent to the peaks in triple or quadruple tops.
Reverse head-and-shoulders pattern:
Is the mirror image of the configuration shown above which marks the end of an uptrend. So the reverse head-and-shoulders pattern typically marks the end of a downtrend.
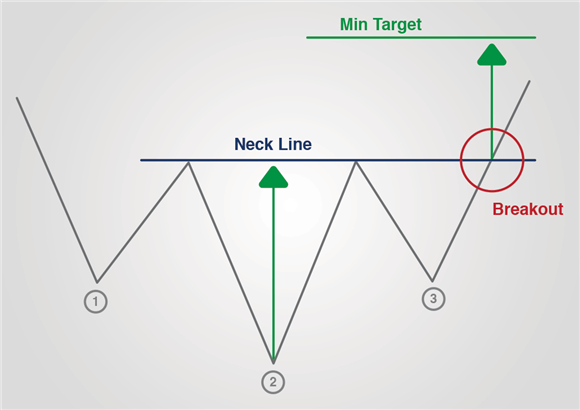
It is a similar arrangement for a head-and-shoulders pattern. The neckline can be seen below:
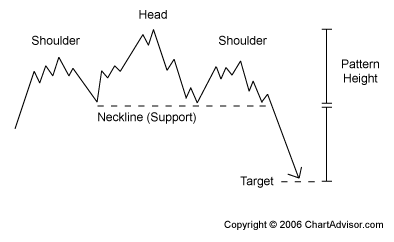
This shows a head-and-shoulders top. The neckline is formed by drawing a line linking up the lows formed after the first shoulder and the subsequent head. Once the second (right hand) shoulder is formed, the neckline becomes a significant area of support. If the price breaks below here then there’s a strong possibility that prices will continue to decline. In other words, the head-and-shoulders pattern signals that the price action has reversed and is now heading downwards after previously trending up before forming the pattern. Now, it’s also important to measure the distance between the neckline and the top of the “head”. This is the pattern height and typically traders then anticipate prices falling by a similar amount below the neckline. If they do then this can be a place to buy back and book profits. However, it could be worth moving a stop down to just above the neckline in the hope of capitalising on an additional move downwards.
Here’s an inverse head and shoulders that was formed on the UK100 between August 2015 and June 2016. Typically, technical traders would look to place a buy order in once the price breaks above the neckline after forming the right shoulder. Traders generally look for a rally which would be the same size as the distance between the “head” and the neckline.
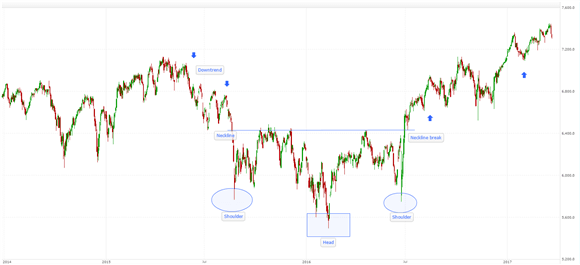
So what we’re looking out for are signs that a move may be about to reverse direction. Here we’ve seen some chart patterns indicating that a reversal may be on the cards. But before taking action it’s important to get confirmation. Experienced traders look for additional evidence often by employing momentum and volume indicators and maybe some candlestick analysis. Please refer to our guides under the “News & Education” tab on our website which cover these topics in more detail.
Disclaimer
Spread Co is an execution only service provider. The material on this page is for general information purposes only and nothing contained herein constitutes (or should be taken to constitute) financial or other advice which should be relied upon. It has not been prepared with your personal circumstances, financial situation, needs or objectives in mind, therefore any actions taken or not taken by any person on the basis of this material is done entirely at their own risk. Spread Co accepts no responsibility whatsoever for any such actions, inactions or resulting consequences. No opinion expressed in the material shall amount to (or be taken to amount to) an endorsement, recommendation or other such affirmation of the suitability or unsuitability of any particular investment, transaction, strategy or approach for any specific person. This material has not been prepared in accordance with legal requirements designed to promote the independence of investment research and is considered a marketing communication. As such, this communication is not subject to any prohibition on dealing ahead of the dissemination of investment research. Nonetheless, Spread Co operates a conflict of interest policy to prevent the risk of material damage to our clients.
Recent guides
Easy To Open An Account
Reliable Platform
With our platforms you can trade wherever you are – at home, in the office, or when you’re out and about.
0% financing on short index positions
Some companies will charge you to hold a short index position. At Spread Co we won’t.
Powerful Charting
Spread Co charts are powered by TradingView Inc.
Sign Up For A Demo Account Create A Live AccountStart here
Markets
Spread Co Limited is a limited liability company registered in England and Wales with its registered office at 22 Bruton Street, London W1J 6QE. Company No. 05614477. Spread Co Limited is authorised and regulated by the Financial Conduct Authority. Register No. 446677.