Spread Betting and CFDs are complex instruments and come with a high risk of losing money rapidly due to leverage. 71.8% of retail investor accounts lose money when trading Spread Betting and CFDs with this provider. You should consider whether you understand how Spread Betting and CFDs work and whether you can afford to take the high risk of losing your money
MACD Explained
What does macd stand for and how do you use it?
MACD stands for moving average convergence divergence. It is a trend following momentum indicator which can be used to help identify if a new trend is developing.
MACD EXPLAINED
The MACD looks at the relationship between exponential moving averages (EMA). When you first apply it to a chart you’ll see three numbers in the set-up box, typically 12, 26 and 9. This is the default setting which you’ll find on the Spread Co platform. The 12 is the number of bars (these represent any unit of time, for instance one hour or one day) in the faster moving average. The 26 is the number of bars in the slower moving average. The third number (which is typically 9 in default mode) represents the number of bars in which the difference between the faster and slower moving averages has been calculated.
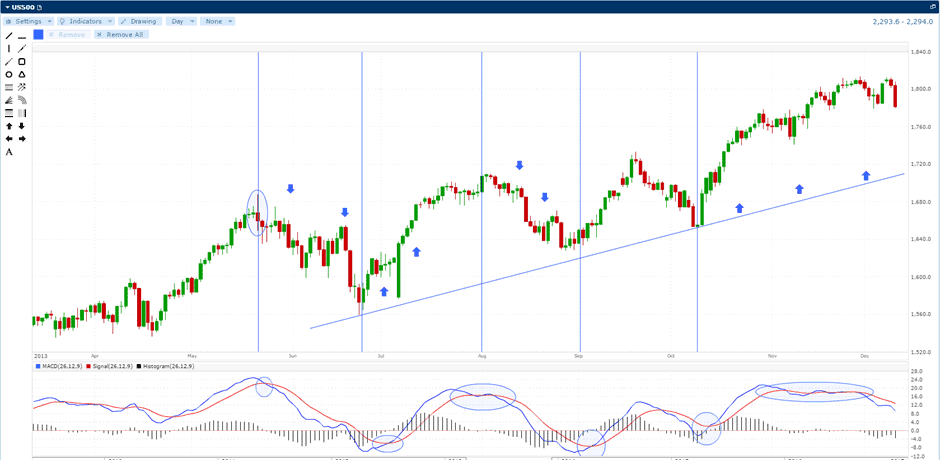
The indicator appears underneath the chart itself. Here it is in close-up:

Now, the MACD line itself is the difference between the 12-bar and 26-bar moving averages. This typically shows up as a blue line on the indicator. The signal line (often red) is a 9-bar moving average of the MACD line itself and the histogram is plotted in black either side of the horizontal (zero) line. The histogram simply plots the difference between the MACD and signal lines. If you look at the example above you can see that the histogram is zero when the MACD and signal line cross. As the two moving averages separate, or diverge, the histogram gets bigger.
What are macd crossovers?
When the MACD crosses below the signal line, it is a bearish signal which indicates that the trend may have turned down. Conversely, when the MACD rises above the signal line, this is bullish suggesting that the trend and the price of the asset may be heading higher. Some traders watch for the MACD and/or signal line to cross above the central (zero) horizontal line and take this as a buy signal. If they cross below then it’s a sell signal.
The trouble with these methods is that there can be plenty of situations when such crossovers occur but that the market doesn’t follow the predicted change in trend. This is particularly the case when markets are range-bound or trading sideways. In such cases it is possible to get “whipsawed” – that is, buy when the MACD breaks above the signal line, or sell when it breaks below, only to get stopped out as the market subsequently snaps back. This is why it’s vitally important not to make trading decisions on the basis of the MACD alone. Instead, try to get confirmation of a trend change by using other indicators as well. The Directional Movement Indicator can help to establish if a market is trending or ranging. It can also be worth using moving averages with different timeframes (perhaps 20 and 50-day for example) and overlay these on the price chart.
CHART WITH SIMPLE CROSSOVERS

MACD DIVERGENCE
This occurs less frequently but is a much more reliable trading signal. When the underlying price action of the financial instrument diverges from the MACD, it can signal the end of the current trend.
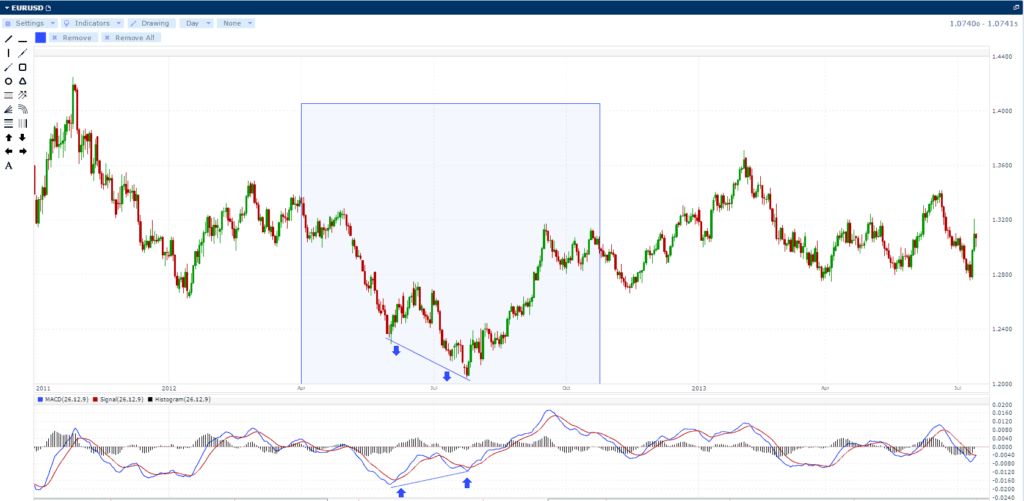
Here’s a good example using the EURUSD:

If we look at the price action highlighted in the box, we can see the EURUSD trending downwards. We then see the price bounce before it sells off again to establish a lower low. But at the same time we can see that the MACD and signal line have made a higher low. This is what is meant by divergence. The interpretation of this is that a brief short-covering bounce petered out and the selling resumed. However, the sell-off happened on lower momentum. In other words, prices were falling but at a decreasing rate. The divergence between the MACD and the underlying price action signalled that a change in trend could be forthcoming. And that was exactly what happened as the EURUSD proceeded to climb steadily over the next few months.
But please remember: it’s very important not to rely on just one indicator alone. So use the MACD in conjunction with other indicators. Also, consider using other moving averages and perhaps a trend-following drawing tool such as Andrews’ Pitchfork to help identify trading opportunities.
Disclaimer
Spread Co is an execution only service provider. The material on this page is for general information purposes only and nothing contained herein constitutes (or should be taken to constitute) financial or other advice which should be relied upon. It has not been prepared with your personal circumstances, financial situation, needs or objectives in mind, therefore any actions taken or not taken by any person on the basis of this material is done entirely at their own risk. Spread Co accepts no responsibility whatsoever for any such actions, inactions or resulting consequences. No opinion expressed in the material shall amount to (or be taken to amount to) an endorsement, recommendation or other such affirmation of the suitability or unsuitability of any particular investment, transaction, strategy or approach for any specific person. This material has not been prepared in accordance with legal requirements designed to promote the independence of investment research and is considered a marketing communication. As such, this communication is not subject to any prohibition on dealing ahead of the dissemination of investment research. Nonetheless, Spread Co operates a conflict of interest policy to prevent the risk of material damage to our clients.
Recent guides
Easy To Open An Account
Reliable Platform
With our platforms you can trade wherever you are – at home, in the office, or when you’re out and about.
0% financing on short index positions
Some companies will charge you to hold a short index position. At Spread Co we won’t.
Powerful Charting
Spread Co charts are powered by TradingView Inc.
Sign Up For A Demo Account Create A Live AccountStart here
Markets
Spread Co Limited is a limited liability company registered in England and Wales with its registered office at 22 Bruton Street, London W1J 6QE. Company No. 05614477. Spread Co Limited is authorised and regulated by the Financial Conduct Authority. Register No. 446677.