Spread Betting and CFDs are complex instruments and come with a high risk of losing money rapidly due to leverage. 71.7% of retail investor accounts lose money when trading Spread Betting and CFDs with this provider. You should consider whether you understand how Spread Betting and CFDs work and whether you can afford to take the high risk of losing your money

Moving averages as a technical indicator

What is a moving average?

Moving Averages are lagging indicators as they are based on past prices. Nevertheless, they can help highlight a trend and they can also help identify areas of support and resistance. In addition, many traders look for times when a shorter-term moving average crosses above or below a longer-term moving average as this can signal that a change of trend is occurring and provide the basis of a buy or sell signal. A typical example would be when a 50-day crosses a 100-day. However, few analysts would use this as a trading signal in isolation, and would look for confirmation of a trend reversal from other technical indicators.
At Spread Co we offer three different types of moving average and these are described below.

Moving average – simple

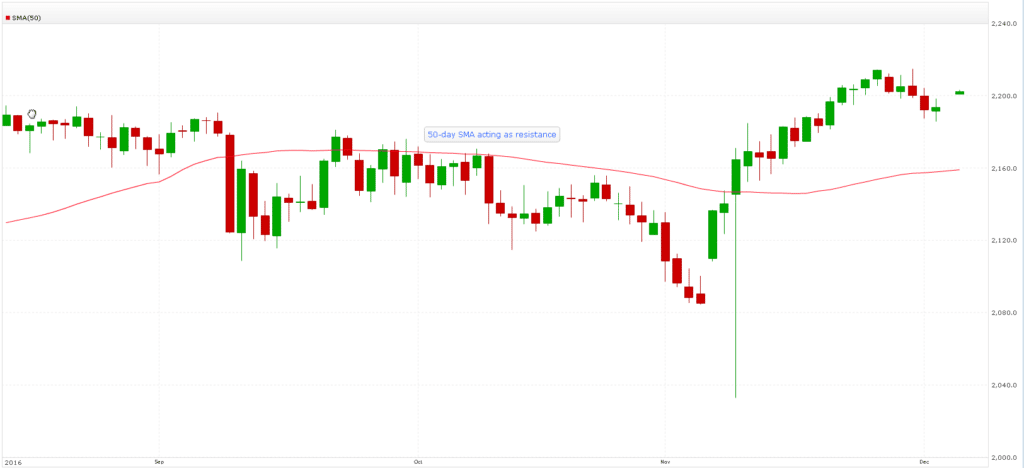
A simple moving average is the sum of closing prices for a certain number of days divided by that number of days. So, a 10-day moving average is the sum of closing prices for 10 days divided by 10. A 200-day moving average is the last 200 daily closes divided by 200. As each day passes, the oldest day’s data is dropped and the newest day’s data added. A chart overlay is then plotted accordingly which helps to smooth out price data. SMAs can be particularly effective when used to identify areas of support and resistance.

Moving average – exponential

An Exponential Moving Average (EMA) is more complex than a Simple Moving Average (SMA) as it is calculated by assigning greater importance to the most recent data and weighting the calculation accordingly. An EMA takes an SMA as its starting point. Then a weighting multiplier is calculated which varies depending on the time period of the EMA. The multiplier is then used to calculate fresh values for the EMA and a chart overlay is plotted accordingly. EMAs calculated over short time-frames have bigger weighting multipliers than EMAs calculated over long time-frames. EMAs have less lag than SMAs so are better for trend-following. But SMAs tend to work better when used to identify lines of support and resistance.

Moving average – weighted

Weighted (WMA) Moving Averages are more complex than Simple Moving Averages (SMA) as they are calculated by assigning greater importance to the most recent closes and weighting the calculation accordingly. As with Exponential Moving Averages (EMAs), they take an SMA as their starting point. But unlike EMAs, rather than manipulating the data with a weighting multiplier, the weighting declines arithmetically as the data gets older. Like EMAs, WMAs have less lag so are better than SMAs for trend-following. But SMAs tend to work better when used to identify lines of support and resistance.

Crossover examples

Disclaimer

Spread Co is an execution only service provider. The material on this page is for general information purposes only and nothing contained herein constitutes (or should be taken to constitute) financial or other advice which should be relied upon. It has not been prepared with your personal circumstances, financial situation, needs or objectives in mind, therefore any actions taken or not taken by any person on the basis of this material is done entirely at their own risk. Spread Co accepts no responsibility whatsoever for any such actions, inactions or resulting consequences. No opinion expressed in the material shall amount to (or be taken to amount to) an endorsement, recommendation or other such affirmation of the suitability or unsuitability of any particular investment, transaction, strategy or approach for any specific person. This material has not been prepared in accordance with legal requirements designed to promote the independence of investment research and is considered a marketing communication. As such, this communication is not subject to any prohibition on dealing ahead of the dissemination of investment research. Nonetheless, Spread Co operates a conflict of interest policy to prevent the risk of material damage to our clients.

Recent guides

Easy To Open An Account

Reliable Platform

With our platforms you can trade wherever you are – at home, in the office, or when you’re out and about.

0% financing on short index positions

Some companies will charge you to hold a short index position. At Spread Co we won’t.

Powerful Charting

Spread Co charts are powered by TradingView Inc.

Sign Up For A Demo Account Create A Live Account