Spread Betting and CFDs are complex instruments and come with a high risk of losing money rapidly due to leverage. 67.8% of retail investor accounts lose money when trading Spread Betting and CFDs with this provider. You should consider whether you understand how Spread Betting and CFDs work and whether you can afford to take the high risk of losing your money
Identifying Market Tops, or the trend is your friend – until it isn’t
What is a market top?
The market top is when a financial market hits its highest price over a particular period of time. It is often said that markets move in ways to inflict the maximum amount of pain to the greatest number of people. The statement is undoubtedly cynical yet it highlights how easy it is to personalise the market and blame it when things go wrong. But the market isn’t itself a living, breathing malevolent organism whose only goal is to humiliate anyone who goes near it. Rather, it is the result of billions of decisions and actions carried out daily by millions of individuals. Even computerised trades and algorithms originate from programmes created by humans – for now, anyway.
Blaming the market (or anything else for that matter) for one’s trading losses shows how important it is to try and take the emotion out of trading. The best way to do this is to establish a process for analysing and identifying potentially profitable trades. This will include an original trade idea followed up by fundamental analysis, technical analysis, money management and risk management. Think of each trade as a test of your market hypothesis, rather than a battle of you against the market. In this way you take responsibility for your trading decisions. That may feel uncomfortable when things go wrong, but it means you have a chance to learn from your mistakes. This is why disciplined money and risk management is so important. You have to make sure that your potential downside on each and every trade is minimised. If the potential loss on a trade is such that it would jeopardise your ability to trade again, then walk away. This will help you to maintain your mental as well as your financial capital.
So how does one go about identifying potentially winning trades? Well it isn’t easy and it takes study, experience and ultimately courage to put one’s money on the line. But spotting a trending market can certainly help. It’s an old cliché to say “the trend is your friend”, but there’s undoubtedly truth in it. Just look back at the US stock market over the past eight years. The thing is that it can be difficult to identify when a trend is developing. It can also be emotionally difficult to join in on a trend if it has been running for some time. We generally want to buy when things are cheap and sell them when they’re expensive. If an equity, stock index or commodity is making a succession of fresh highs it can be much more tempting to want to bet on it going down than going up further. This is particularly the case for anyone who ended up on the wrong side of a market crash such as the financial crisis of 2008/9, the Dot Com crash in 2000, the Asian Financial crisis of 1997 or the 1987 meltdown.
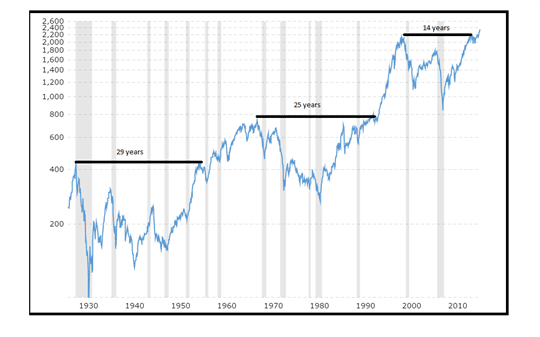
Here’s a chart of the S&P500 going back to before the Wall Street Crash of 1929. This is on a log scale and is inflation adjusted. Recessions are shown by the vertical grey areas. Chart courtesy of Macrotrends.

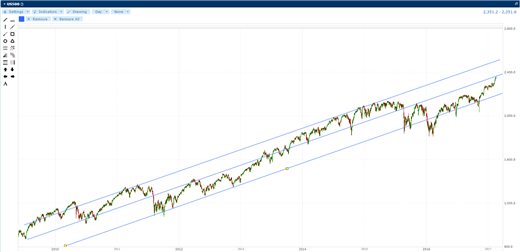
As you can see, if you had bought into the broad market in 1929, it would have taken you around 29 years to make back the money you lost in the subsequent crash. More recently, it took 14 years for the S&P500 to make a fresh high after the Dot Com bust. So we want to avoid buying near the top. But how can we know when the top is in? As we can see from this chart of the S&P500 from 2009 to early 2016, the positive trend is pretty obvious. But can it possibly have further to go?

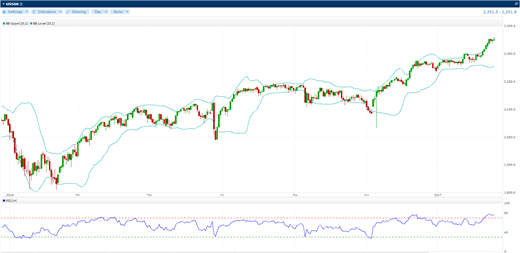
Here’s a chart showing the S&P500 since the beginning of 2016. I’ve added on standard Bollinger Bands and the Relative Strength Indicator as an underlay.

The RSI is above 70 suggesting that the S&P500 is overbought. At the same time prices are bouncing up along the higher of the two Bollinger bands. Taking these two indicators together would suggest that the S&P is due a pull-back. And that could well be the case. However, if we add on a few exponential averages we can see that the trend remains positive.

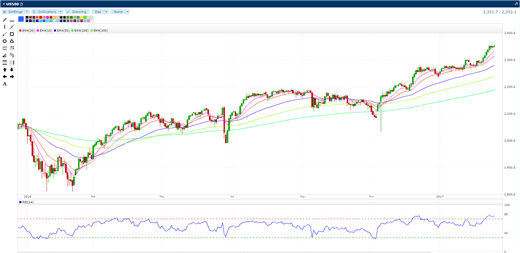
This is rather difficult to see, but I’ve overlaid the 10, 20, 50, 100 and 200-day exponential moving averages (EMA). In this chart we have all moving averages in perfect bullish alignment. That is, 10 at the top followed by 20, then 50, then 100 with the 200 (in darker green) being the lowest on the chart. Now, the shorter the period of a moving average, the more volatile and sensitive it is and the more quickly it adjusts to prices trending higher or lower. Traders watch for cross-overs where the faster moving average crosses above (buy signal) or below (sell signal) the slower moving average(s). We last saw a cross-over back in early November just after the Presidential election. This saw the 10-day break above the 20, 100 and 50-day moving averages and the 20 break above the 100 and 50. That was a bullish signal and the S&P500 has risen around 8% since then.
So many traders will be looking at the current set-up and ride the trend, ignoring the overbought RSI, along with the expanding Bollinger Band. Instead they will keep a close eye on the moving averages and watch for evidence that the upside momentum is waning. For some this could mean the 10-day moving average turning lower and breaking below the 20. Others may wait for additional evidence, perhaps from a completely different indicator. But what this does show is the importance of looking at more than one indicator to obtain confirmation before making a trading decision.
Disclaimer
Spread Co is an execution only service provider. The material on this page is for general information purposes only and nothing contained herein constitutes (or should be taken to constitute) financial or other advice which should be relied upon. It has not been prepared with your personal circumstances, financial situation, needs or objectives in mind, therefore any actions taken or not taken by any person on the basis of this material is done entirely at their own risk. Spread Co accepts no responsibility whatsoever for any such actions, inactions or resulting consequences. No opinion expressed in the material shall amount to (or be taken to amount to) an endorsement, recommendation or other such affirmation of the suitability or unsuitability of any particular investment, transaction, strategy or approach for any specific person. This material has not been prepared in accordance with legal requirements designed to promote the independence of investment research and is considered a marketing communication. As such, this communication is not subject to any prohibition on dealing ahead of the dissemination of investment research. Nonetheless, Spread Co operates a conflict of interest policy to prevent the risk of material damage to our clients.
Recent guides
Easy To Open An Account
Reliable Platform
With our platforms you can trade wherever you are – at home, in the office, or when you’re out and about.
0% financing on short index positions
Some companies will charge you to hold a short index position. At Spread Co we won’t.
Powerful Charting
Spread Co charts are powered by TradingView Inc.
Sign Up For A Demo Account Create A Live AccountStart here
Markets
Spread Co Limited is a limited liability company registered in England and Wales with its registered office at 22 Bruton Street, London W1J 6QE. Company No. 05614477. Spread Co Limited is authorised and regulated by the Financial Conduct Authority. Register No. 446677.