Spread Betting and CFDs are complex instruments and come with a high risk of losing money rapidly due to leverage. 71.8% of retail investor accounts lose money when trading Spread Betting and CFDs with this provider. You should consider whether you understand how Spread Betting and CFDs work and whether you can afford to take the high risk of losing your money
Fibonacci Retracement Extensions
What are fibonacci retracement extensions?
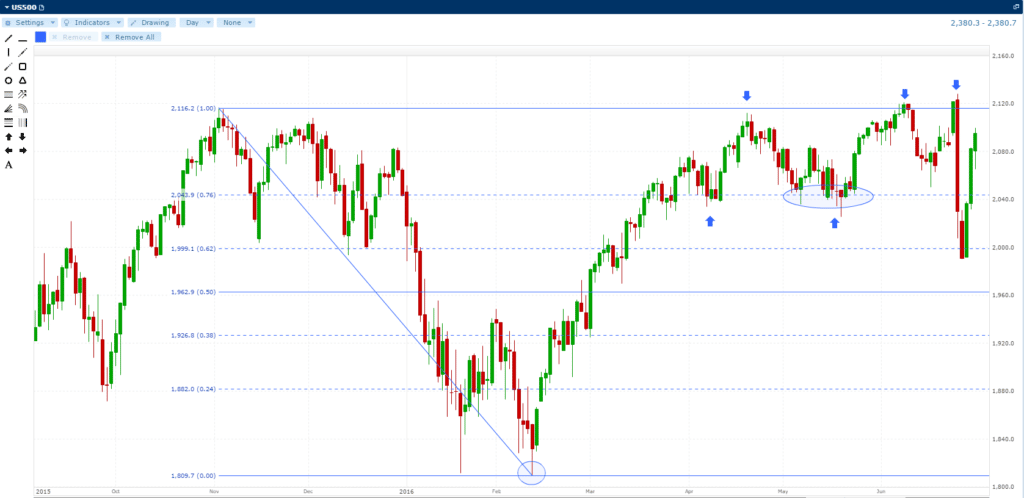
Fibonacci retracement extensions are a drawing tool used on charts by traders highlighting potential levels for profits. On the face of it, a simple Fibonacci Retracement would appear to be redundant in terms of identifying significant areas of support and resistance once prices have retraced 100% of their initial move. Here we have a chart of the S&P500:

What we can see here is that after the sell-off which gave us the key high-low of the Fibonacci Retracement, the S&P rallied sharply. What we can also see is that the rally was strong and fairly relentless. The only significant pause came after the S&P had retraced more than 76% of the initial move. This was one of those occasions when the Fib drawing tool was of very little help when it came to identifying significant trading levels. Pull-backs were shallow making it difficult to establish new long positions, while shorting the index would have proved very expensive indeed. There were a few possible trading opportunities around the 0.76 area, but these were high risk and would have required some deftness to execute profitably.
But that needn’t mean that there’s nothing else to be learnt from the initial sell-off that was the basis for drawing on the Fib in the first place. Sure, one could start again by marking out a new Fib retracement, but this wouldn’t be ideal. Firstly, although you could still work with the established low point, you now have to pick a high at a time when the index hasn’t finished its current upside move and so could end up making new highs, and that’s like trying to nail down jelly.
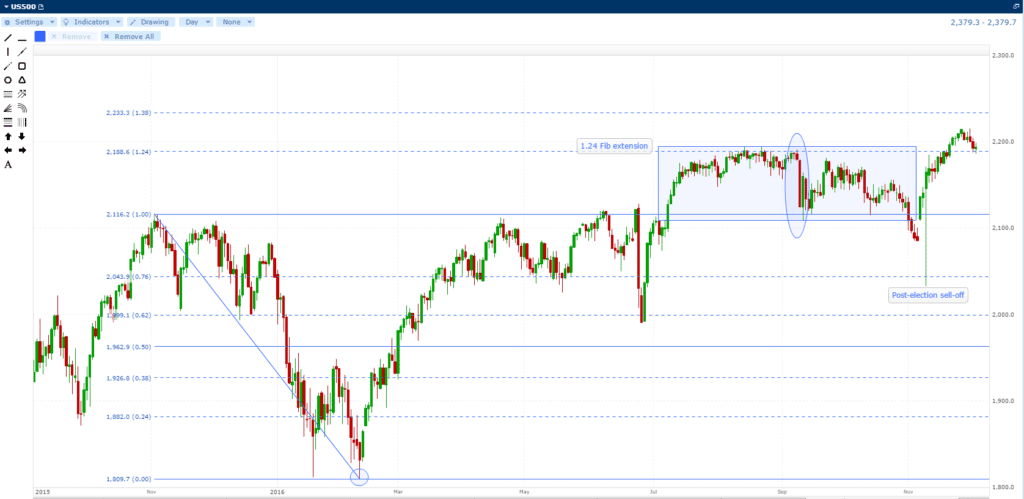
Secondly, the whole idea of the Fibonacci retracement is to help identify where prices may encounter significant areas of support or resistance in the future. It helps to have a decent amount of historical data to help with this. Fortunately, we don’t have to start all over again as the Fibonacci Retracement extensions beyond the full 100% move which can be very helpful in identifying significant price levels. Here’s the S&P again using the same initial high-low points for the Fibonacci extensions:

As we can see the 1.24 extension held as resistance for a significant period. In addition, there was a particularly violent move when the S&P briefly broke above 2,188 then failed to hold here on a closing basis only to fall below and then bounce off the 1.0 Fib line at 2,116. That represented a 72 point, or 3%, move in under three days. What this goes to show is that the Fib can still have validity even after the market has retraced 100% of the original move. In fact, the price action beyond the original move can often throw up stronger trading signals.
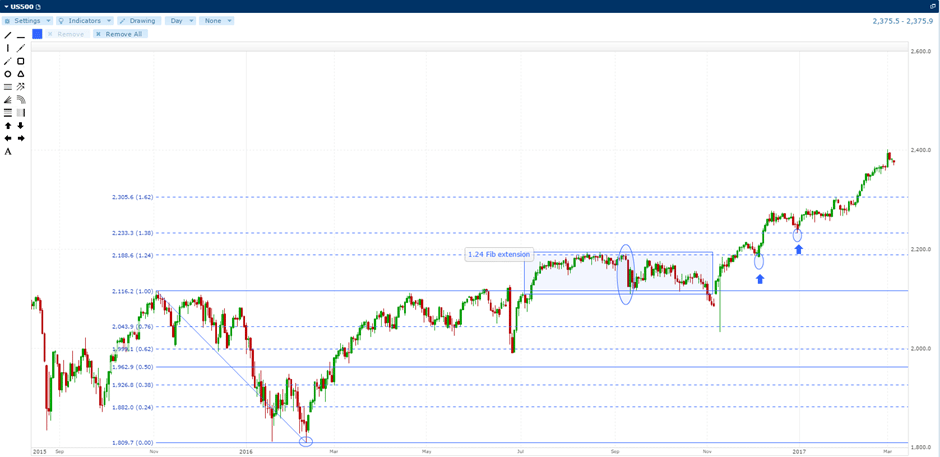
By extending the chart out further we can see that the S&P500 soon resumed its rally. But interestingly price activity around the Fibonacci Retracement Extensions indicated a couple of occasions when a modest pull-back would have indicated some potential buying opportunities. These are marked with circles and arrows.

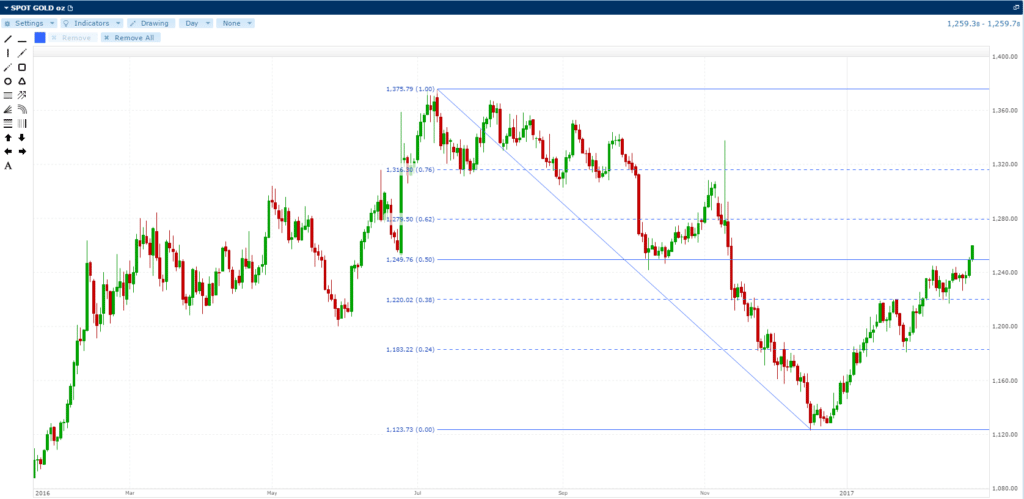
Of course it’s fair to say that in these examples I’m back-tracking and fitting in price activity to the drawing tool. Despite this it is still interesting to see how often this market has found support, or run into resistance, at specific Fibonacci levels. I’ve highlighted some others below:

It’s important to note that Fibonacci retracement extensions may work very well for a particular market for a length of time but then stop being effective. Likewise, it’s quite common to draw on Fib retracements and find no fit whatsoever. Then again, some Fib levels may work well for certain markets but not others. The rule is not to force compliance. In other words, don’t try and visualise significant trading levels where none exist.
Also, remember that Fibonacci levels are just a guide. It could be that certain markets conform better to Gann levels than Fibonacci ones for instance. So make sure you don’t put all your faith in just one or two drawing tools or technical indicators. In addition there’s no such thing as a sure bet, so always use strict risk and money management.
Disclaimer
Spread Co is an execution only service provider. The material on this page is for general information purposes only and nothing contained herein constitutes (or should be taken to constitute) financial or other advice which should be relied upon. It has not been prepared with your personal circumstances, financial situation, needs or objectives in mind, therefore any actions taken or not taken by any person on the basis of this material is done entirely at their own risk. Spread Co accepts no responsibility whatsoever for any such actions, inactions or resulting consequences. No opinion expressed in the material shall amount to (or be taken to amount to) an endorsement, recommendation or other such affirmation of the suitability or unsuitability of any particular investment, transaction, strategy or approach for any specific person. This material has not been prepared in accordance with legal requirements designed to promote the independence of investment research and is considered a marketing communication. As such, this communication is not subject to any prohibition on dealing ahead of the dissemination of investment research. Nonetheless, Spread Co operates a conflict of interest policy to prevent the risk of material damage to our clients.
Recent guides
Easy To Open An Account
Reliable Platform
With our platforms you can trade wherever you are – at home, in the office, or when you’re out and about.
0% financing on short index positions
Some companies will charge you to hold a short index position. At Spread Co we won’t.
Powerful Charting
Spread Co charts are powered by TradingView Inc.
Sign Up For A Demo Account Create A Live AccountStart here
Markets
Spread Co Limited is a limited liability company registered in England and Wales with its registered office at 22 Bruton Street, London W1J 6QE. Company No. 05614477. Spread Co Limited is authorised and regulated by the Financial Conduct Authority. Register No. 446677.